

New Money, Same Risks: The Reality of Institutional Crypto
Despite Crypto’s Wall Street Makeover, Risk Remains!

Crypto Risk in 2025: What’s Changing?

As 2025 unfolds, institutional adoption of Bitcoin continues to grow, yet market volatility remains high. Bitcoin ETFs now hold $115 billion in AUM, with $32 billion in net inflows, capturing 5.7% of total BTC supply—solidifying Bitcoin’s place in institutional portfolios.
At the same time, policy shifts and economic uncertainty are reshaping market conditions. The new U.S. administration’s pro-crypto stance has reignited debates over a national Bitcoin reserve, while recently imposed tariffs have intensified global trade tensions, weighing on broader financial markets.
Despite rising institutional exposure, crypto markets have seen a resurgence of speculation, with AI-related tokens and meme coins (incl. $TRUMP) experiencing extreme price swings before collapsing shortly after. Yet, Bitcoin remains locked in a $90k–$105k range with a current annualized return of 39%, while Ethereum’s continued underperformance raises concerns about market momentum and investor sentiment.
Amid shifting market conditions, reassessing digital asset risk is critical.
Key questions include:
How has volatility evolved in recent months?
What does Bitcoin’s latest correlation data reveal about its role in a portfolio?
How should investors interpret recent market behavior in light of macroeconomic shifts?
This article analyzes key risk indicators, offering data-driven, actionable insights for institutional investors and asset managers to strengthen risk assessment and inform strategic portfolio decisions.
Key Takeaways
Crypto market risk remains high despite institutional adoption, with volatility and drawdowns requiring structured risk management.
Bitcoin’s evolving correlation with gold and equities underscores the need for dynamic, data-driven allocation strategies.
ETF flows have fueled institutional engagement, but fund movements indicate tactical positioning rather than long-term conviction.
Risk at a Glance: Key Market Indicators
To assess crypto market risk, we analyze the following financial key metrics:
Volatility Trends: Rolling 30-day volatility for crypto (i.e., BTC, ETH, and SOL) and traditional assets/indices (i.e., S&P 500 and Gold).
Correlation Shifts: BTC’s evolving correlation with traditional assets/indices, particularly the S&P 500 and Gold.
Drawdown: Maximum drawdowns (MDD) over 30 and 90 days for BTC and ETH.
ETF Flows: Net inflows in U.S.-listed BTC spot ETFs as a proxy for institutional demand.
These indicators provide a structured approach to assessing crypto market risks in a recently changing economic and political environment. The data is as of February 11, 2025, unless explicitly stated otherwise.
What the Data Reveals
Crypto’s Risk Profile Remains Elevated

BTC’s 30-day rolling volatility remains at ~40%, significantly higher than the S&P 500 (~20%) and Gold (~15%).
ETH and SOL exhibit even greater volatility, reinforcing their higher risk-return trade-offs compared to BTC.
Bitcoin’s Macroeconomic Sensitivity

BTC-Gold correlation has been highly unstable since November 2024, oscillating between positive and negative values, highlighting its inconsistent role as a macro hedge.
BTC-S&P 500 correlation remains erratic, reflecting its sensitivity to shifting risk conditions and ongoing equity market influence.
Deep Corrections Remain a Defining Risk
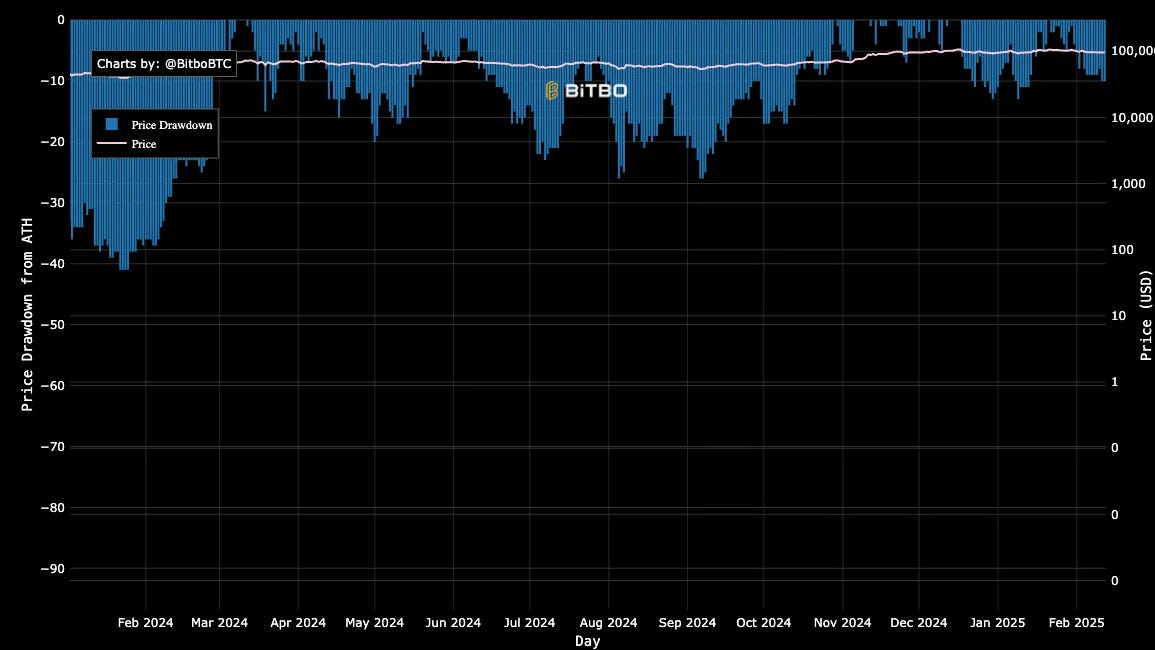
BTC’s maximum 30-day drawdown was -9.8%, while the 90-day drawdown reached -12.87%—significantly lower than ETH (-35.02%) and SOL (-29.91%).
ETH and SOL’s drawdowns reaffirm that crypto markets remain prone to sharp corrections, requiring active risk mitigation strategies.
Tactical ETF Exposure Management

The daily BTC ETF flow vs. price comparison shows a close relationship between large net inflows and upward price movements, particularly in November and December 2024, when BTC rallied past $100k.
However, January 2025 saw more balanced flows, with both inflows and outflows present, corresponding to BTC’s range-bound trading ($90k–$105k).
Strategic Insights for Smarter Portfolio Decisions
1. Crypto’s Volatility is Structural, Not Temporary
BTC remains significantly more volatile than traditional assets, requiring strict risk budgeting and portfolio sizing.
ETH and SOL’s higher volatility and drawdowns reinforce the need for active risk management in institutional portfolios.
2. Bitcoin’s Correlation with Gold and Equities is Unstable
BTC’s correlation patterns fluctuate, requiring dynamic allocation strategies rather than static portfolio assumptions.
Its inconsistent correlation with gold challenges the “digital gold” narrative, while equity market influence remains significant.
3. Drawdowns Reinforce the Need for Hedging
BTC’s lower drawdowns compared to ETH and SOL support its position as the primary institutional crypto asset.
Hedging strategies using volatility targeting or structured derivatives are essential for managing downside risk.
4. Institutional Demand is Growing but Tactical
ETF inflows are a major BTC price driver, but redemptions on volatility spikes show institutions actively manage exposure rather than passively holding.
Tracking ETF flows is crucial to anticipate liquidity shifts and market movements.
Traditional investors incorporating BTC should apply risk overlays and volatility-adjusted sizing to account for crypto’s deep correction risks.
Managing Risk in an Unstable Crypto Market
Institutional adoption of Bitcoin continues, yet new money has done little to change the same risks—crypto remains highly volatile, with unstable correlations and deep drawdowns reinforcing the need for active risk management.
While ETF flows have fueled demand, institutional positioning appears to be tactical, making liquidity trends a key factor to watch. Investors integrating digital assets hence must adapt to evolving market conditions, apply structured risk frameworks, and stay agile in portfolio allocation.
This edition marks a broader shift toward more data-driven insights and institutional-grade analyses targeting finance professionals.
As part of this direction, I’m currently developing an interactive Crypto Analytics App and seeking alpha testers for feedback. If you’re interested, feel free to reach out via Substack, LinkedIn, or simply fill out this Google form.