BlackRock’s Bitcoin Play: Evaluating the 2% Allocation Strategy
An Empirical Analysis of Bitcoin’s Diversification and Growth Potential in Investment Portfolios
Introducing BlackRock’s Bitcoin Strategy

BlackRock's Bitcoin ETF launch in 2024 became the most successful ETF debut in history, highlighting the growing institutional confidence in cryptocurrencies as an asset class. In December 2024, BlackRock reinforced this confidence with its published report, “Mega Forces: Sizing Bitcoin in Portfolios.” The report outlines a compelling investment thesis, advocating for a 2% Bitcoin allocation within traditional portfolios.
This approach, according to BlackRock, balances Bitcoin’s outsized growth potential with manageable risk, leveraging its unique traits: low correlation with traditional asset classes, dynamic responses during market stress, and strong long-term performance.
The Need For Rigorous Evaluation
As BlackRock positions Bitcoin as a portfolio hedge, it becomes imperative to rigorously evaluate its practical impact on risk-return performance. Understanding the implications of digital assets for investment portfolios is critical for investors and finance professionals seeking to make informed investment decisions.
Against this background, this exclusive article kicks off a series critically evaluating BlackRock’s Bitcoin strategy. By integrating institutional perspectives with empirical scrutiny, the series seeks to analyze and challenge BlackRock’s claim. This part addresses two fundamental questions in particular:
Does a 2% Bitcoin allocation enhance returns and diversification benefits?
What are the trade-offs in terms of risk?
We address these questions by blending institutional theory with rigorous, data-driven analysis, with the aim of gaining actionable insights into the role of digital assets in investement portfolios.
In future articles, we will evaluate portfolio performance during significant market downturns, delve into the detailed analysis of 2024’s performance, and explore the implications of larger Bitcoin allocations (5%, 10%, and 20%) through scenario analyses.
Methodology
To evaluate BlackRock's digital asset strategy, this study employs a comparative, data-driven framework. We analyze the performance across two portfolios:
Classic 60/40 Portfolio: Comprising 60% equities and 40% bonds.
BlackRock Strategy: Comprising 58% equities, 40% bonds, and 2% Bitcoin.
Future articles in this series will extend the analysis to explore alternative Bitcoin allocations of 5%, 10%, and 20%, providing deeper insights into the broader implications of higher exposures. In addition, market benchmarks, including equities, fixed income, Gold, and commodities are assessed to contextualize the results.
Key performance indicators for analyzing Bitcoin's risk and return include:
Return Metrics: Cumulative and annualized returns.
Risk Metrics: Annualized volatility, Sharpe ratio, and maximum drawdown.
Risk Contribution: Quantifying Bitcoin’s specific impact on portfolio volatility.
Diversification Benefits: Assessing Bitcoin’s diversification potential involves analyzing its dynamic relationships, including 90-day rolling correlations with major asset classes.
The analysis covers the period from 2019 to 2024, incorporating 2,190 daily logarithmic returns and a forward-filling method to maintain data continuity. This timeframe encompasses major market events such as:
COVID-19 Crash: February–May 2020.
2022 Bear Market.
2023 Downturn: July–September 2023.
Additionally, we focus on 2024 to examine recent portfolio performance, aligning with BlackRock’s latest recommendations.
Data was retrieved from Yahoo Finance for asset prices and the Federal Reserve Economic Data (FRED) for the risk-free rate, specifically the 1-Year US Treasury yield.
Overall, this comprehensive and rigorous approach ensures a thorough assessment of BlackRock's strategy, providing actionable insights for finance professionals and investors.
Analyzing BlackRock’s Strategy: The Risk-Return Trade-Off
The BlackRock Strategy offers valuable insights into whether a 2% Bitcoin allocation achieves the intended balance of enhanced returns and manageable risk. By comparing this strategy to a Classic 60/40 portfolio, we assess Bitcoin’s impact on portfolio performance and risk.
How Does Bitcoin Impact Portfolio Performance?
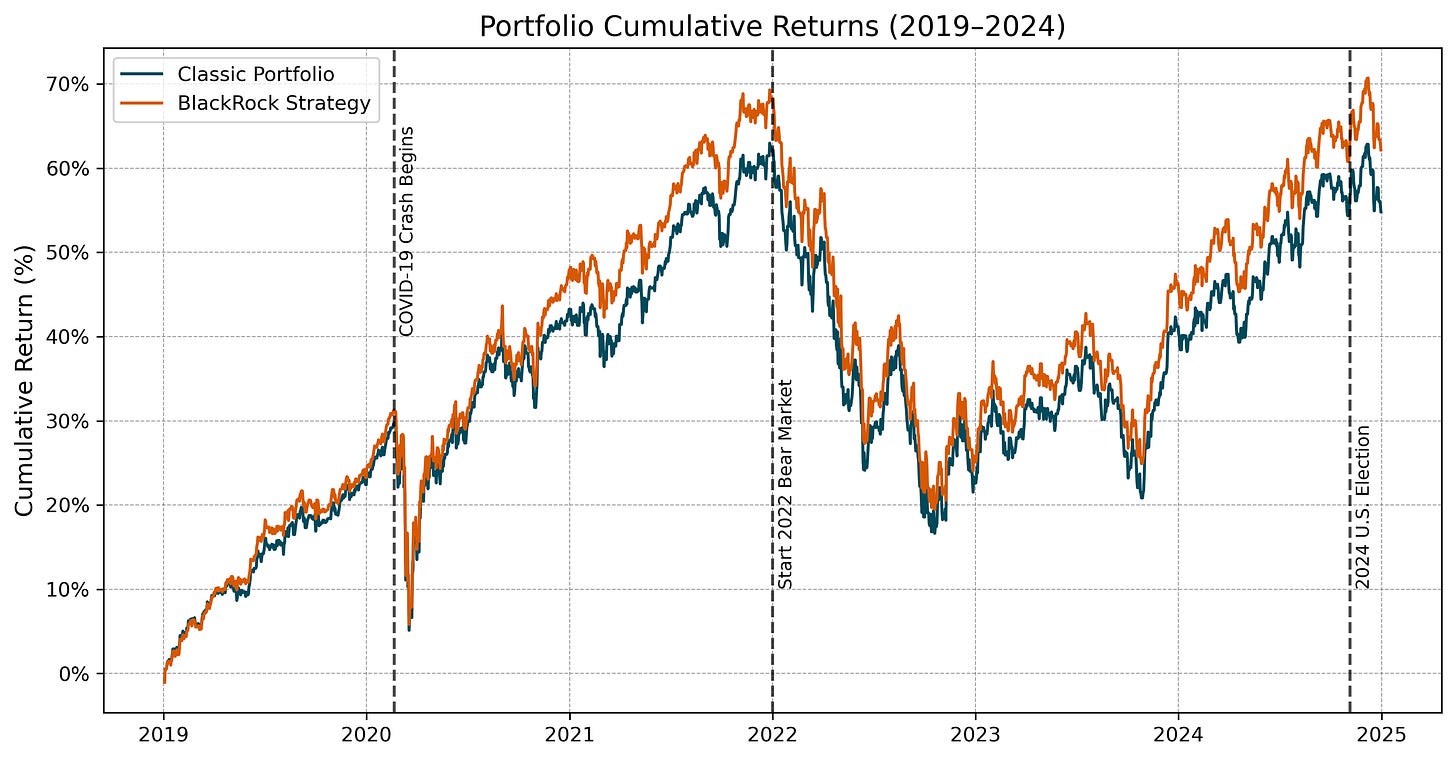
Bitcoin’s inclusion significantly contributes to portfolio growth. As shown in Figure 1, the BlackRock Strategy consistently outperforms the Classic Portfolio, especially during market recoveries, such as post-COVID-19 and the 2023–2024 rally.
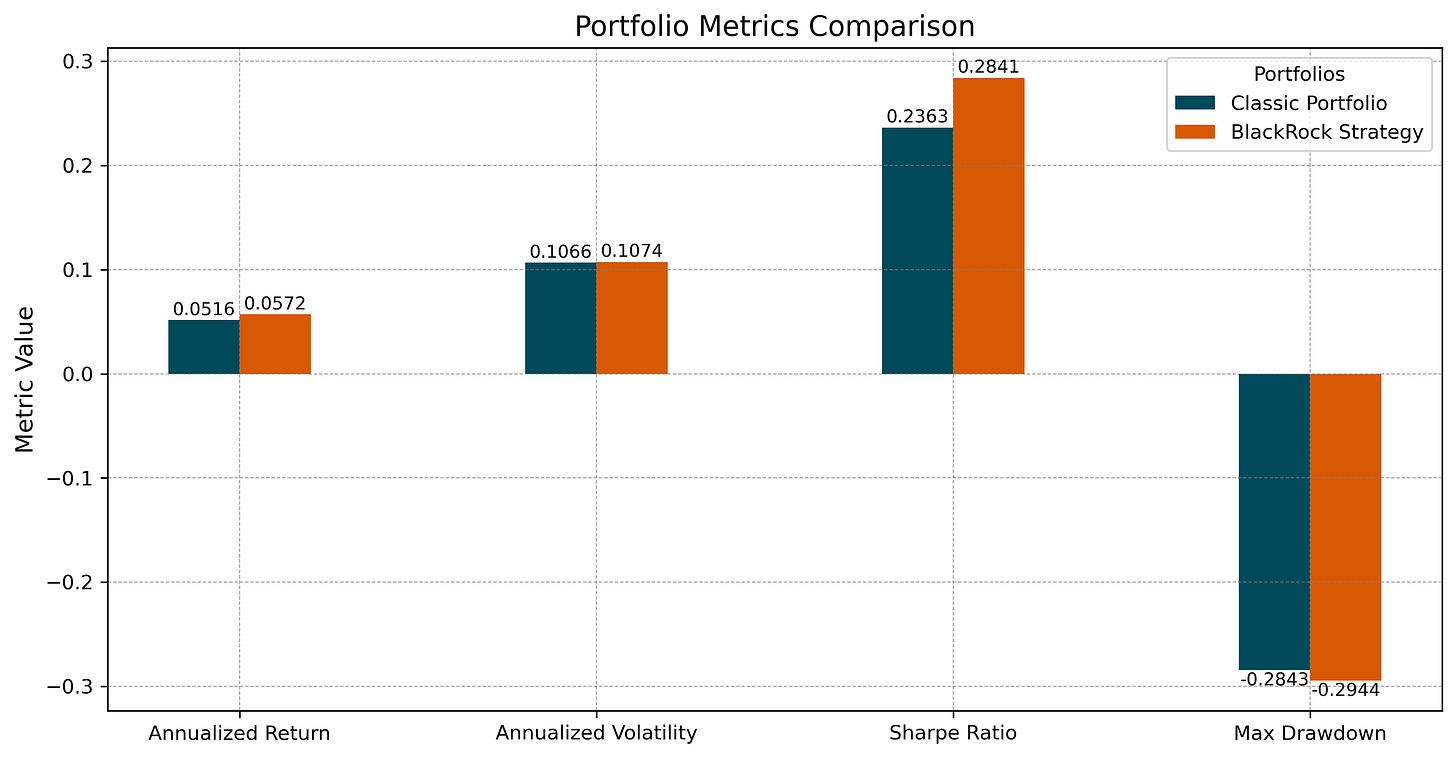
Over the sample period (2019–2024), the BlackRock Strategy delivered a cumulative return of 62.16%, surpassing the Classic Portfolio’s 54.82%. Similarly, its annualized return of 5.72% outperformed the Classic Portfolio’s 5.16% (see Figure 2). This evidence highlights Bitcoin’s role as a return enhancer, even with a modest 2% allocation.
How Does Bitcoin Impact Portfolio Risk?
Despite Bitcoin’s inherent volatility, its 2% allocation mitigates risk exposure with Bitcoin. As illustrated in Figure 2, the BlackRock Strategy exhibits an annualized volatility of 10.74%, compared to 10.66% for the Classic Portfolio.
Maximum drawdowns are slightly higher in the BlackRock Strategy (-29.44%) than in the Classic Portfolio (-28.43%). However, the risk-adjusted performance improves significantly: the Sharpe1 ratio for the BlackRock Strategy rises to 0.2967, a 20% increase over the Classic Portfolio’s 0.2492. This demonstrates Bitcoin’s ability to improve risk-adjusted returns while maintaining manageable overall risk levels.
How Much Does Bitcoin Contribute to Portfolio Risk?
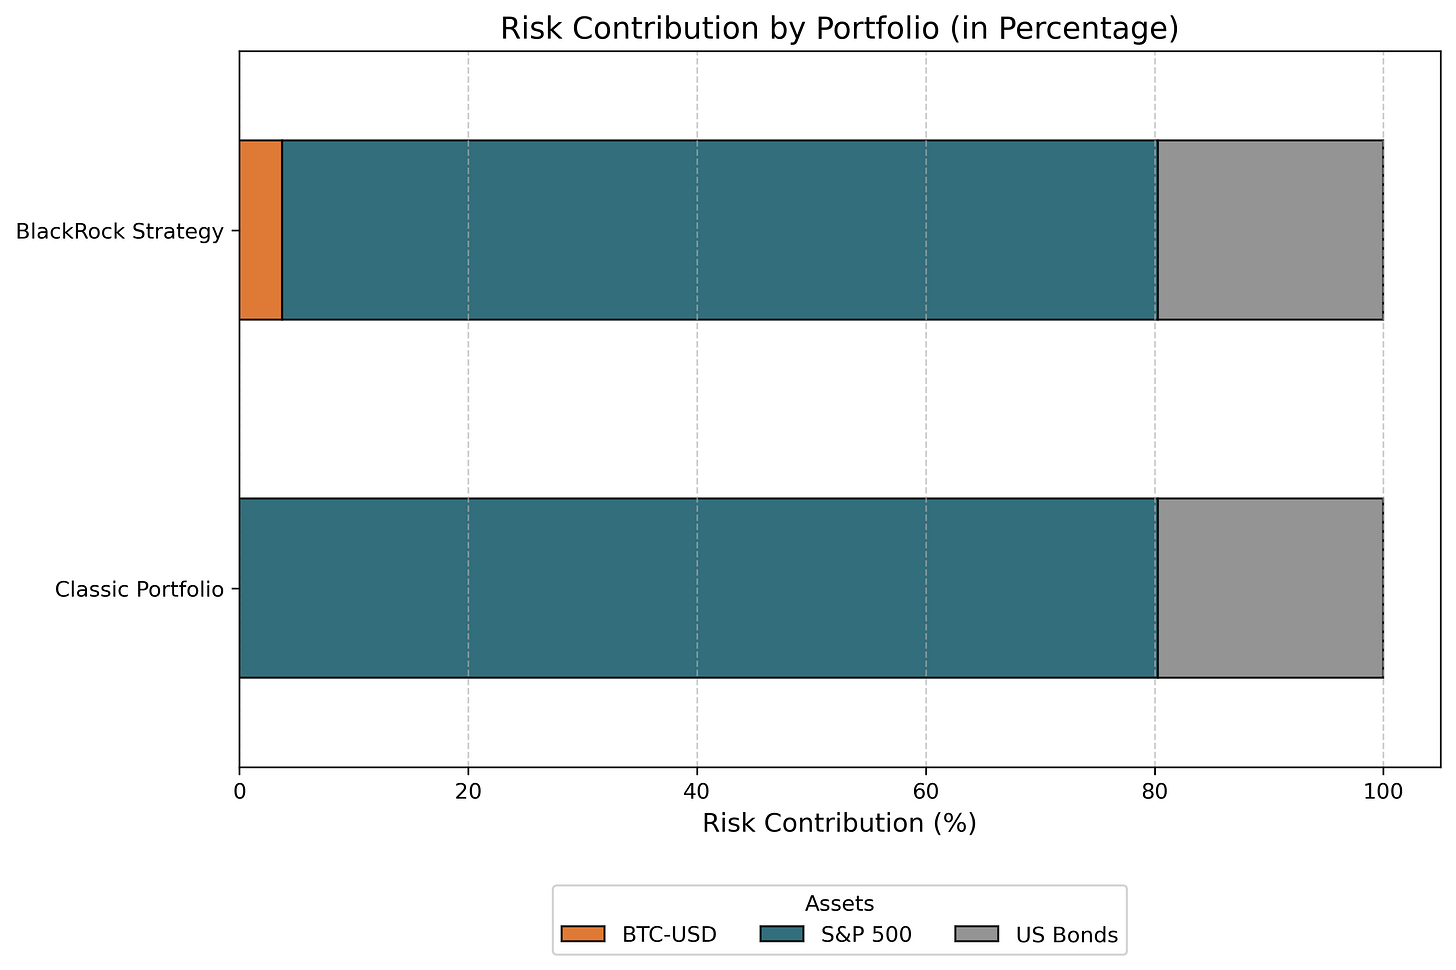
The risk contribution analysis, as shown in Figure 3, provides additional perspective. Bitcoin contributes just 3.75% to the BlackRock Strategy’s total portfolio risk. In contrast, the S&P 500 accounts for 76.53%, while US Bonds contribute 19.71% as a stabilizing factor.
This modest contribution underscores Bitcoin’s role as a diversifier, adding incremental risk without disrupting the portfolio’s overall risk profile.
Does a 2% Bitcoin Allocation Strike the Right Balance?
The data supports BlackRock’s assertion that a 2% allocation achieves a favorable balance. The portfolio benefits from higher returns and significantly improved risk-adjusted metrics, while Bitcoin’s contribution to overall risk remains minimal. This allocation ensures the portfolio retains its traditional equity-bond dominance, with Bitcoin acting as a complementary growth driver.
Testing Bitcoin’s Diversification Benefits
To evaluate BlackRock's assertion that Bitcoin serves as a diversification tool, we analyze its correlations with major asset classes—equities (S&P 500, NASDAQ 100), bonds, gold, and oil—over the 2019–2024 period. This analysis combines a static correlation matrix for an aggregate view with a dynamic rolling correlation analysis to capture temporal variability.
How Does Bitcoin Correlate With Other Assets?
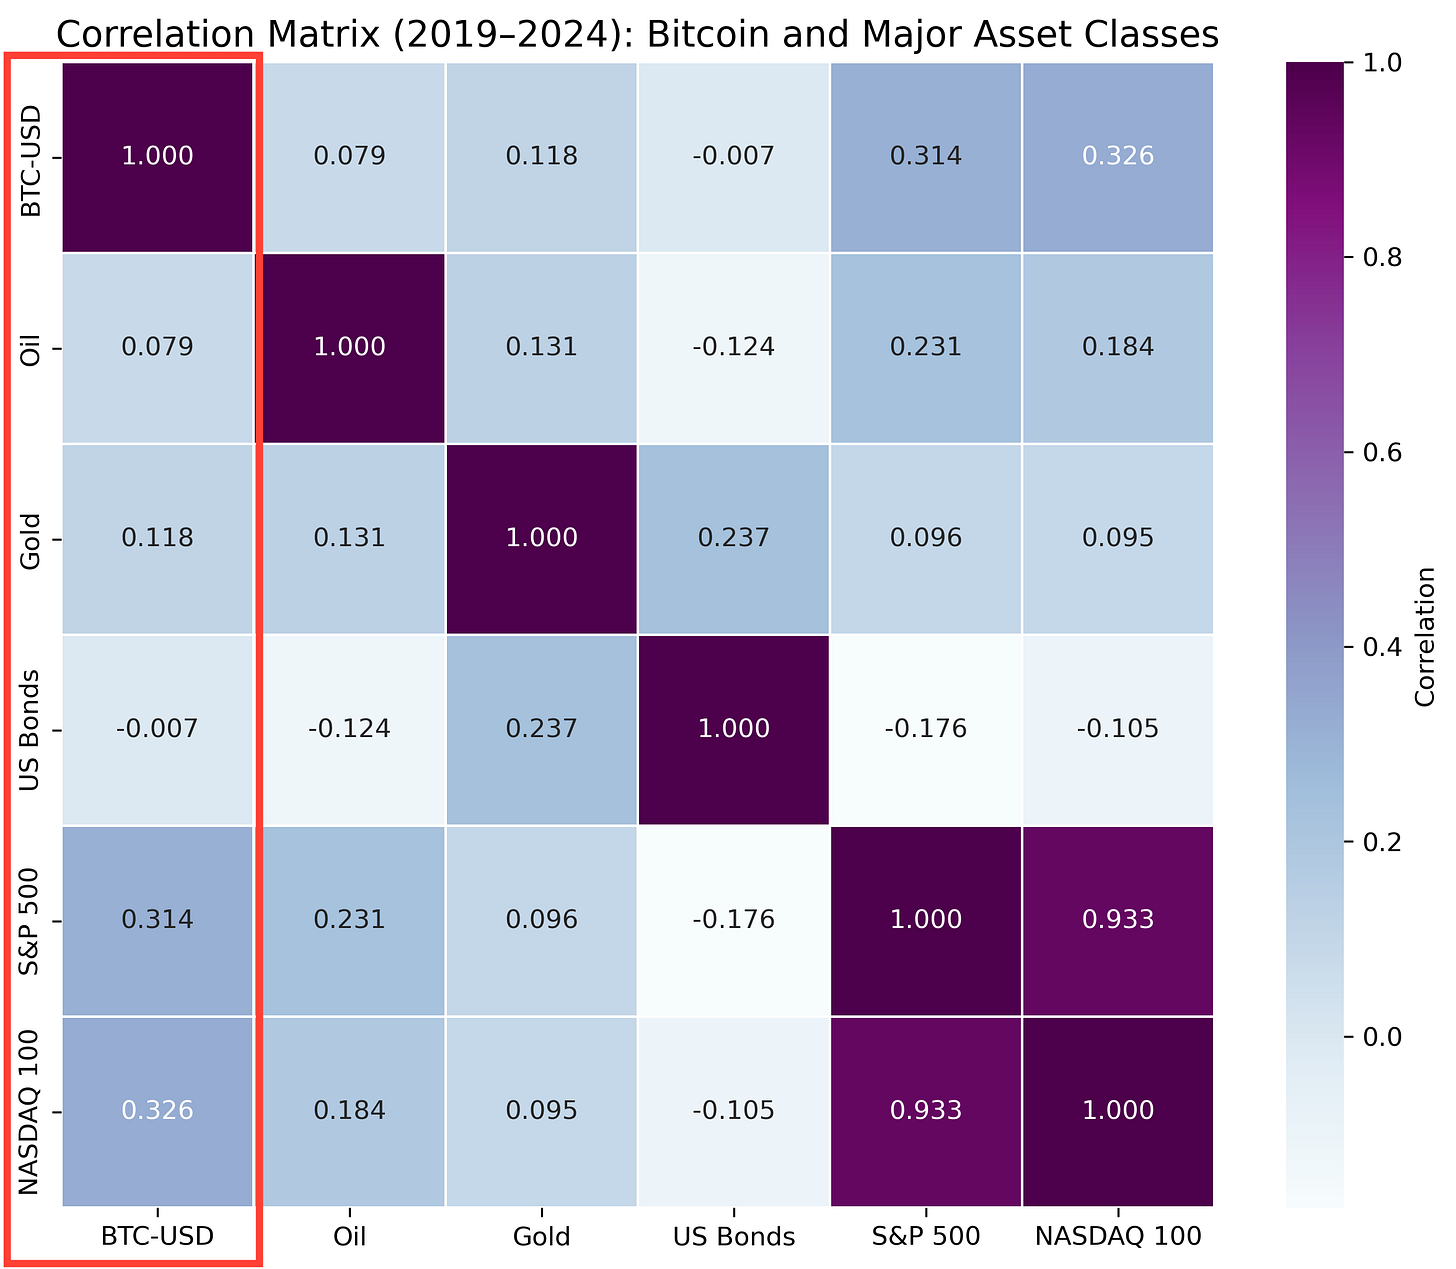
The correlation matrix in Figure 4 provides a comprehensive snapshot of Bitcoin’s average relationships with key asset classes during the study period. Key observations include:
Equities (S&P 500 and NASDAQ 100): Bitcoin displays moderate positive correlation trends with stock markets, averaging 0.314 with the S&P 500 and 0.326 with the NASDAQ 100. This indicates some alignment with risk-on behavior.
1Y US Treasury Bonds: Bitcoin’s correlation with bonds is near zero (0.007), highlighting its independence from fixed-income assets.
Gold: Bitcoin shows a weak positive correlation (0.118) with gold, suggesting limited alignment with traditional safe-haven behavior.
Oil: Bitcoin’s correlation with oil is low (0.079), reinforcing its unique diversification potential relative to commodity-based assets.
These results affirm Bitcoin’s distinctiveness as an asset class, offering diversification benefits through its limited alignment with traditional assets.
How Does Bitcoin’s Dynamic Correlation Enhance Diversification?
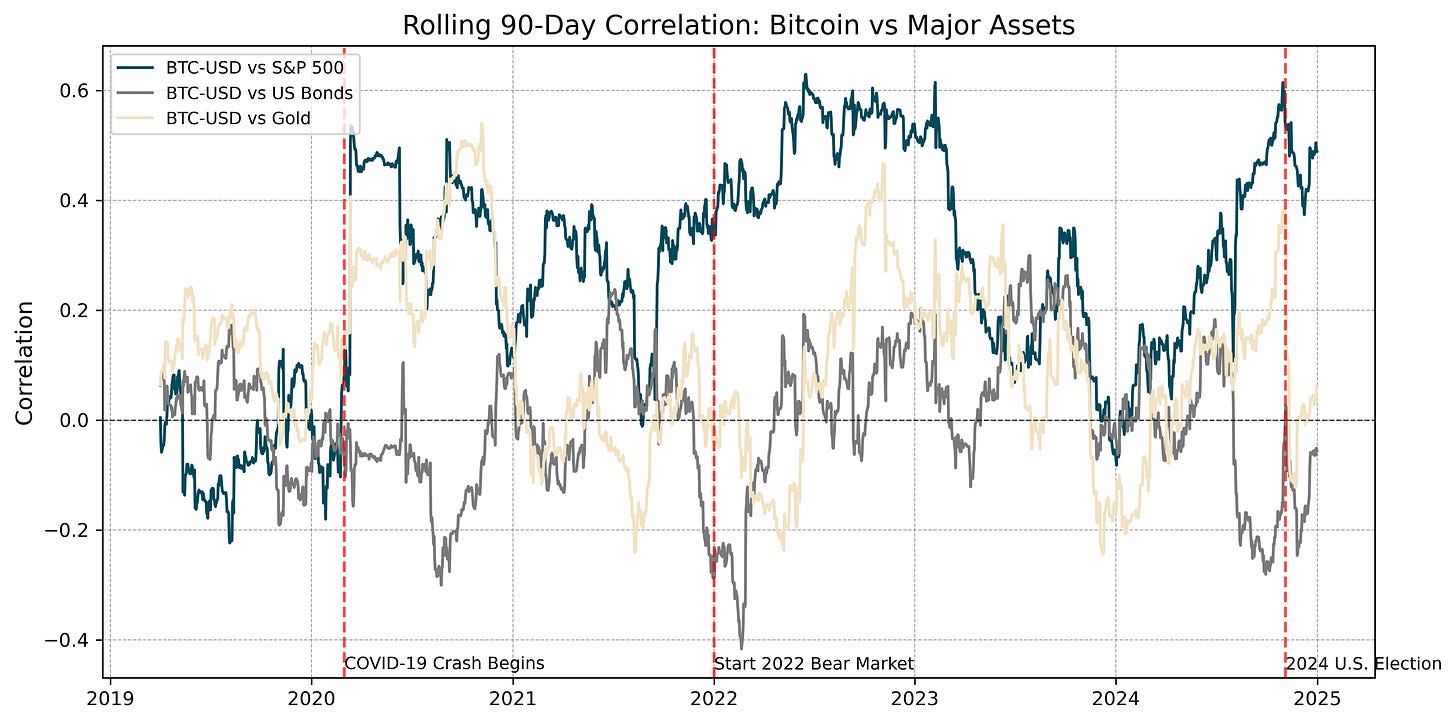
To complement the static view, Figure 5 presents the 90-day rolling correlations between Bitcoin and traditional asset classes, revealing its dynamic and time-varying relationships:
Equities (S&P 500): Bitcoin maintains a moderate positive correlation with equities, averaging 0.271 over the study period. However, the correlation fluctuates significantly, ranging from -0.224 to 0.629 (standard deviation: 20.7%). This variability underscores Bitcoin’s capacity to decouple from equities during certain periods, enhancing its value as a partial diversifier for equity-heavy portfolios.
1Y US Treasury Bonds: Bitcoin’s relationship with bonds remains largely uncorrelated, with an average near zero (-0.003) and a standard deviation of 12.6%. Notably, Bitcoin’s correlation with bonds turns negative during rising-rate environments, such as the 2022 bear market (reaching as low as -0.417), making it a valuable diversifier for bond-heavy portfolios.
Gold: Bitcoin exhibited a weak positive correlation with gold (0.107) but shows variability (standard deviation: 16.2%). While it occasionally aligns with gold, Bitcoin’s behavior diverges significantly, emphasizing its unique diversification characteristics.
What Can the Statistical Distribution of Bitcoin’s Rolling Correlations Tell Us?
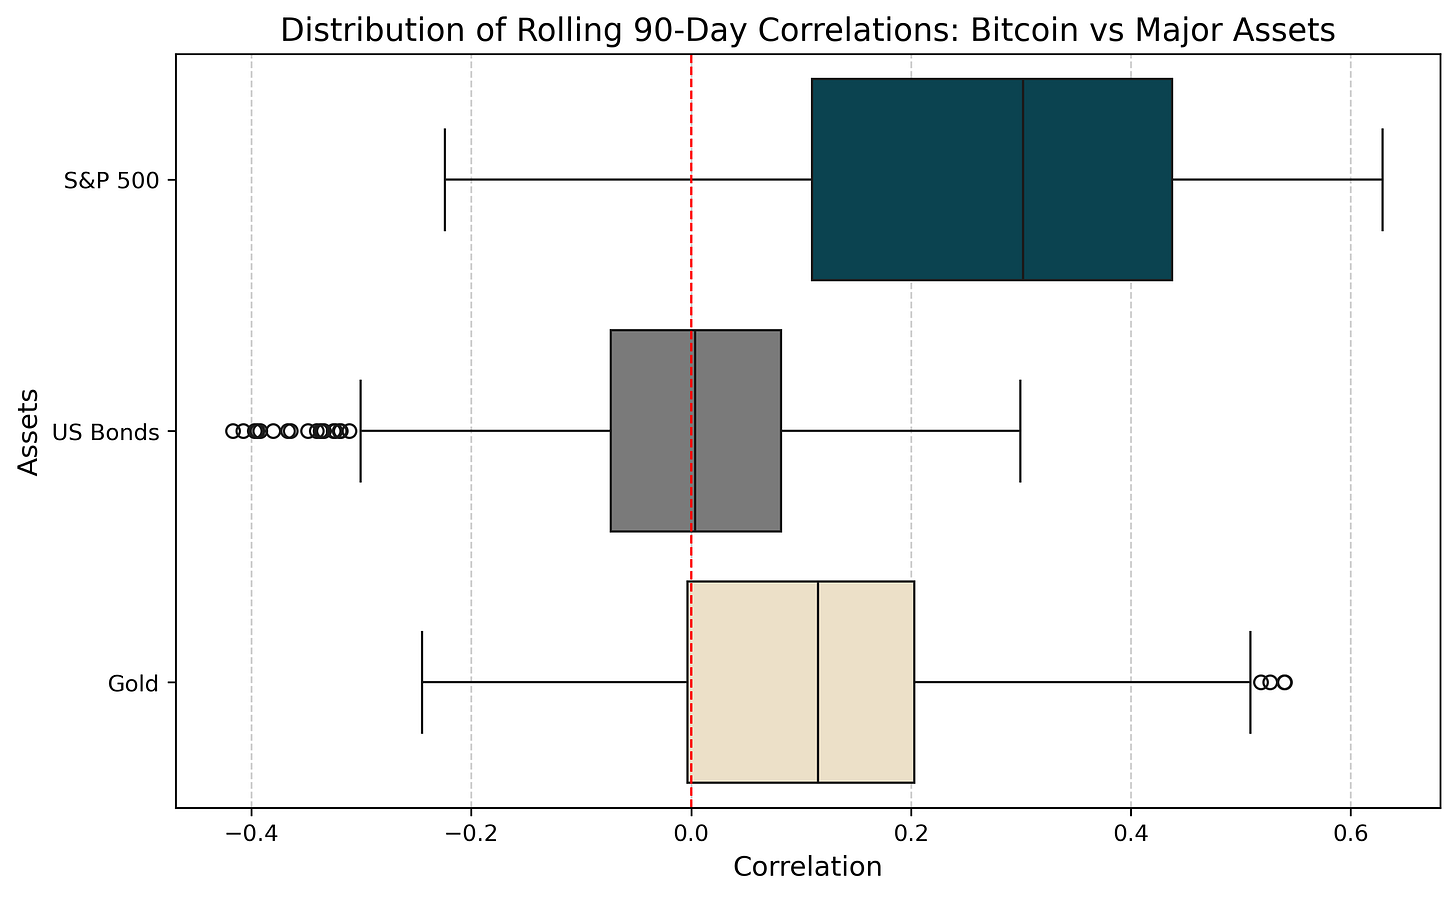
Lastly, Figure 6 provides a visual summary of the statistical distribution of rolling correlations, highlighting Bitcoin’s varying relationships with traditional assets:
Equities: The wide interquartile range for equities reflects Bitcoin’s fluctuating alignment with risk-on behavior.
Bonds: A narrow interquartile range around zero reinforces Bitcoin’s stable independence from fixed-income assets.
Gold: A broader range for gold demonstrates Bitcoin’s occasional alignment but overall distinct behavior from this traditional safe-haven asset.
While these findings establish Bitcoin’s general diversification benefits, its behavior during specific market downturns remains critical to understanding its role as a diversifier. A detailed examination of periods such as the COVID-19 crash, the 2022 bear market, and the 2023 downturn will be presented in the next part of this series, providing deeper insights into Bitcoin’s resilience and adaptability under market stress.
Preliminary Findings and Insights
In this first article, we critically evaluated BlackRock's 2% Bitcoin allocation recommendation by addressing two fundamental questions:
1. Does a 2% Bitcoin Allocation Enhance Returns and Diversification Benefits?
The analysis confirms Bitcoin’s potential to enhance investment portfolio performance. The portfolio with digital assets achieved a cumulative return of 62.16%, outperforming the Classic Portfolio. Annualized returns were similarly higher (5.72% vs. 5.16%), emphasizing Bitcoin’s role as a return enhancer, even at a modest allocation.
As a diversifier, Bitcoin demonstrated low correlations with traditional assets like bonds and gold, while its moderate correlation with equities (e.g., 0.270 with the S&P 500) underscores its partial alignment with risk-on behavior. This combination of independence and selective alignment strengthens its case as a complementary asset within diversified portfolios.
2. What Are the Trade-Offs in Terms of Risk?
Despite Bitcoin’s inherent volatility, the BlackRock Strategy experienced only a marginal increase in risk metrics compared to the Classic Portfolio. Annualized volatility rose slightly, while the maximum drawdown remained comparable.
Additionally, risk contribution analysis revealed that Bitcoin accounted for just 3.75% of the total portfolio risk in the BlackRock Strategy, underscoring its minimal impact on overall risk. The S&P 500 and bonds remained the dominant contributors to portfolio volatility.
Improved risk-adjusted performance further validated BlackRock’s strategy, with a Sharpe ratio of 0.2967—an improvement of more than 20% compared to the Classic Portfolio.
Concluding, these findings support BlackRock’s assertion that a 2% Bitcoin allocation strikes a favorable balance, enhancing returns and diversification while maintaining a manageable risk profile.
Looking Ahead
While this article has validated BlackRock’s initial claim of Bitcoin’s potential to improve risk-adjusted returns and provide diversification, several critical questions remain unanswered:
How does the BlackRock Strategy perform under extreme market conditions, such as the COVID-19 crash and the 2022 bear market?
What insights emerge from Bitcoin’s recent performance in 2024, particularly in relation to its evolving market dynamics?
What are the implications of increasing Bitcoin’s allocation to 5%, 10%, or even 20%?
In the next article of this series, we will address these questions by stress testing the BlackRock Strategy, analyzing its recent performance, and conducting scenario analyses with larger Bitcoin allocations. These insights will further enhance our understanding of cryptocurrency's role in modern portfolios and its potential for widespread adoption.
The Sharpe ratio calculation uses an average annualized risk-free rate of 2.51% (0.0251) over the specified period (2019—2024).


